Distributions
Distributions describe the variability of the underlying data used to produce aggregations.
Viewing distributions
Distributions can be viewed by clicking on any value and selecting Show next to distribution on the tooltip.
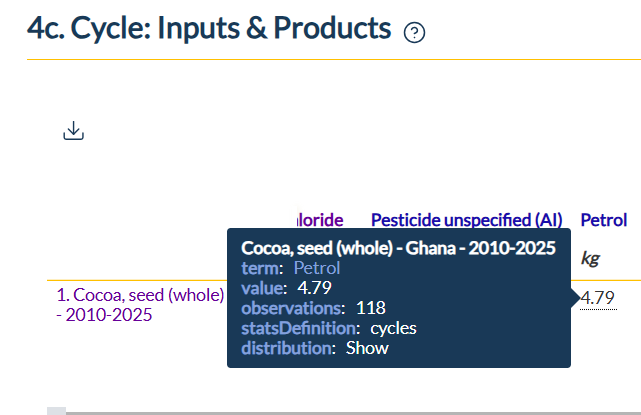
Tooltip for a value, showing distribution button
For emissions with multiple inputs, distributions are generated for the emission associated with each input. The option to show them is in the right-most column of the tooltip.
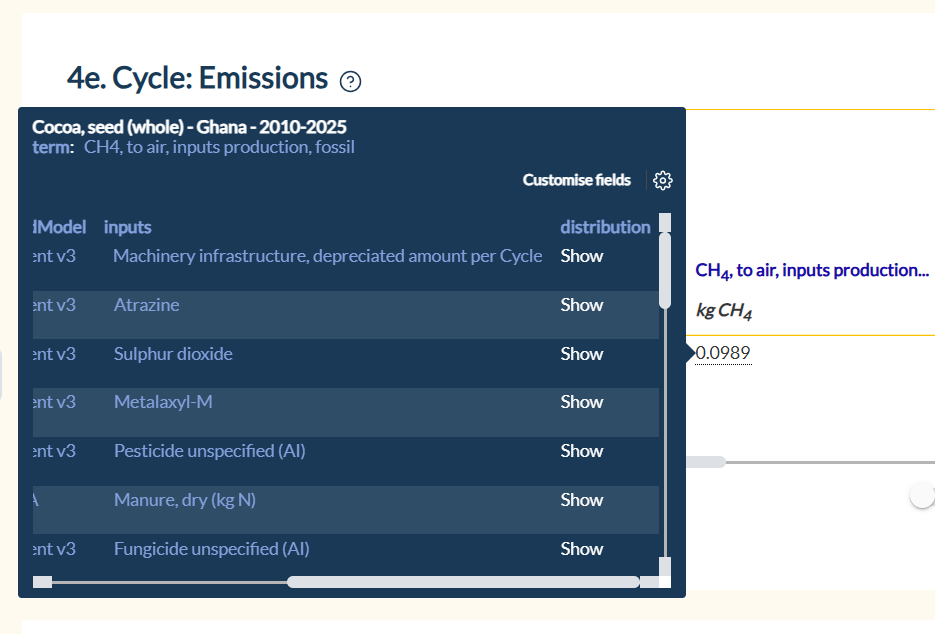
Tooltip for an emissions value with inputs, showing distribution button
Generating distributions
Distributions are generated for the Cycle and Site data in the underlying Cycles by randomly sampling from them 1,000 times.
In some cases, the data in the underlying Cycles contain statistical information (min, max, sd, distribution). This occurs when a single study represents many farms but provides summary statistics instead of per-farm data. This variation is captured by sampling from the data, assuming a normal distribution, with a minimum of 0 where relevant. If a data point has min and max but not sd, the standard deviation is estimated as sd = (max - min) / 4.
To generate Impact Assessment distributions, Impact Assessments are calculated for each point in the 1,000-point distribution of the Cycle emissions and primaryProduct. For simplicity, the distribution of the economicValueShare is not considered.
Background emissions
The method for generating distributions of background emissions depends on the model used to generate the background emission from the input data.
For background emissions from inputs that come from external databases, e.g., for Urea (kg N) the BAFU 2025 model is used, the distribution of these emissions is a rescaled distribution of the inputs associated with them.
For background emissions that use linked Impact Assessments to link the input to other Cycles on the HESTIA platform, e.g., for Saplings, we create the distribution from those other Cycles, using the same process as outlined above, grouping emissions together, e.g., all CO2, to air emissions together, or all N2O, to air emissions together.
For background emissions that use linked Impact Assessments to link the input to other aggregations on the HESTIA platform, e.g., for Oil palm, fruit in an Oil palm, oil (crude) aggregation, we create the distribution by grouping the emission distributions of the linked aggregation together, e.g., all CO2, to air emissions together, or all N2O, to air emissions together.
Covariance Matrix
Covariance matrices are also generated, recording the correlations between every data item in an aggregation.
These are not currently used, but the aim is to implement a statistical method to account for these correlations when generating the Impact Assessment distribution. This will ensure the variance of the distribution is not overestimated.