Navigating the Interface
The Data Explorer uses several key terms (defined in detail in the Data Standard):
- Cycle: the production of a crop, animal, animal product, or processed food during a typical production period.
- Aggregated data: weighted averages of Cycles, aggregated by country and product at 15-to-20-year intervals.
- Source: a peer-reviewed study, database, or other reference from which data are drawn.
- Site: the area on which a Cycle occurred (e.g., a field, pond, building, farm, region, or country).
The main screen, shown below, provides a central interface for accessing and exploring the data.
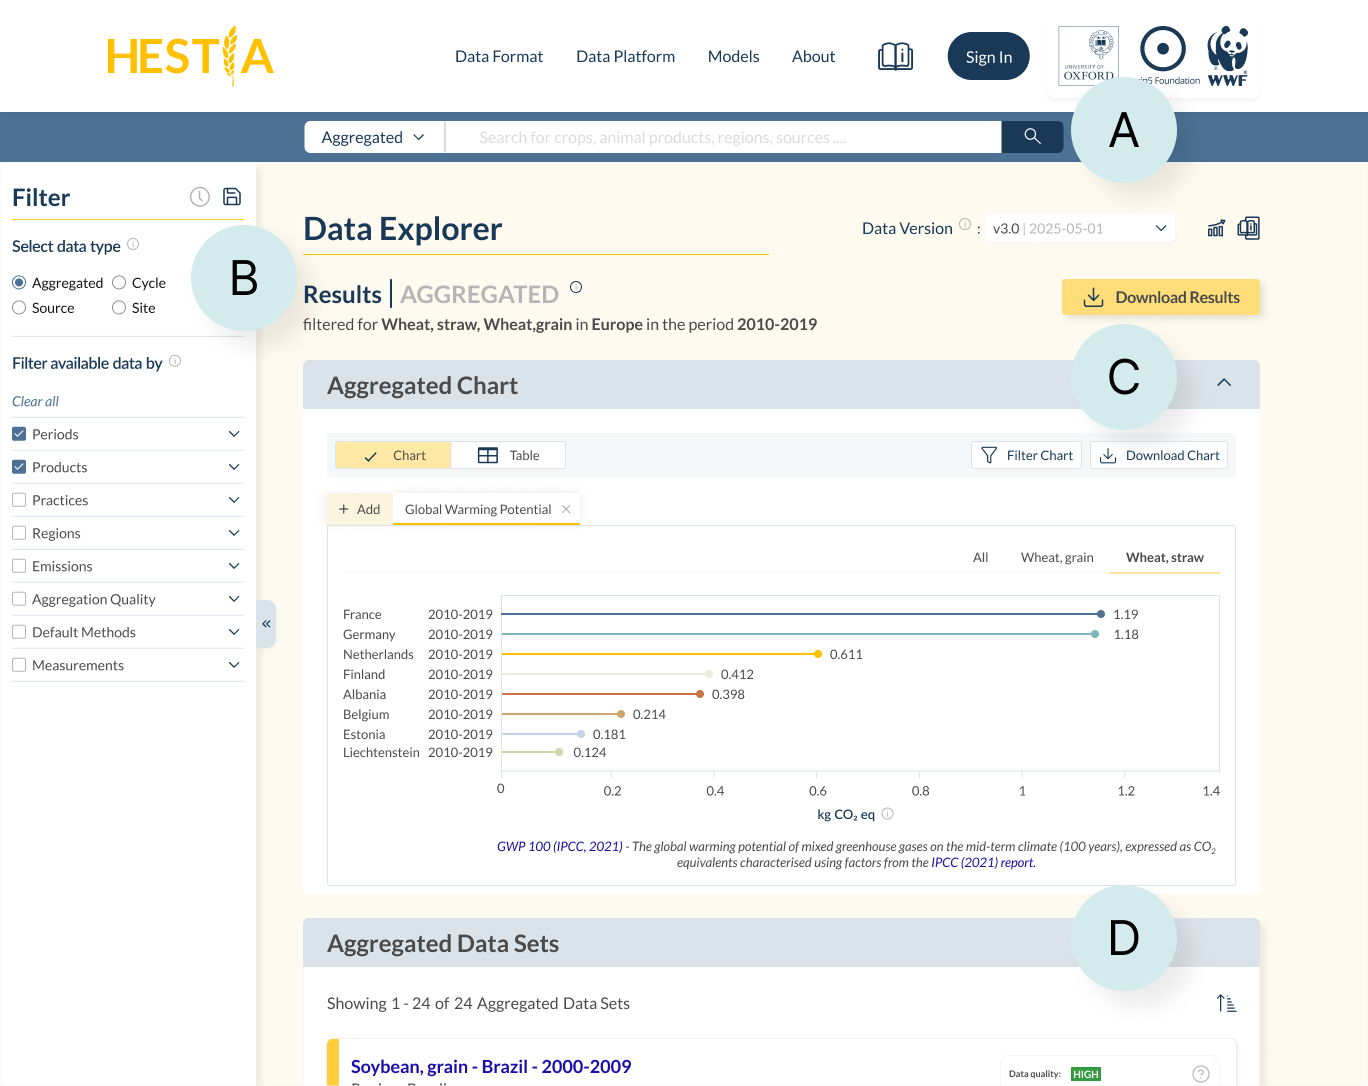
Key functions and features of the Data Explorer
The Data Explorer is divided into several key areas:
- Search Bar (A): search for specific keywords across Cycles, aggregated data, Sites, and Sources.
- Filter Panel (B): narrow results by selecting specific criteria.
- Aggregated Data Chart (C): on aggregated data pages, a chart displays summarised data.
- Result Listings (D): an overview of data matching the current search or filter criteria.